Understanding the I/O behavior of HPC applications is critical to ensuring their efficient use of storage system resources. However, this is a challenging task given the growing depth and complexity of the I/O stack on these systems, where multiple software layers often coordinate to produce optimized I/O workloads for the underlying storage hardware. Darshan is a lightweight I/O characterization tool that helps users navigate this complex landscape by producing condensed summaries[1] of an application’s I/O behavior, including total I/O operation counts, histograms of file access sizes, and cumulative timers, among other statistics. Darshan utilizes a modular runtime architecture, as shown in Figure 1, allowing it to capture data from distinct components of the I/O stack (like I/O libraries and file system interfaces) and to integrate this data into a single log file encapsulating all instrumented I/O data for an application.
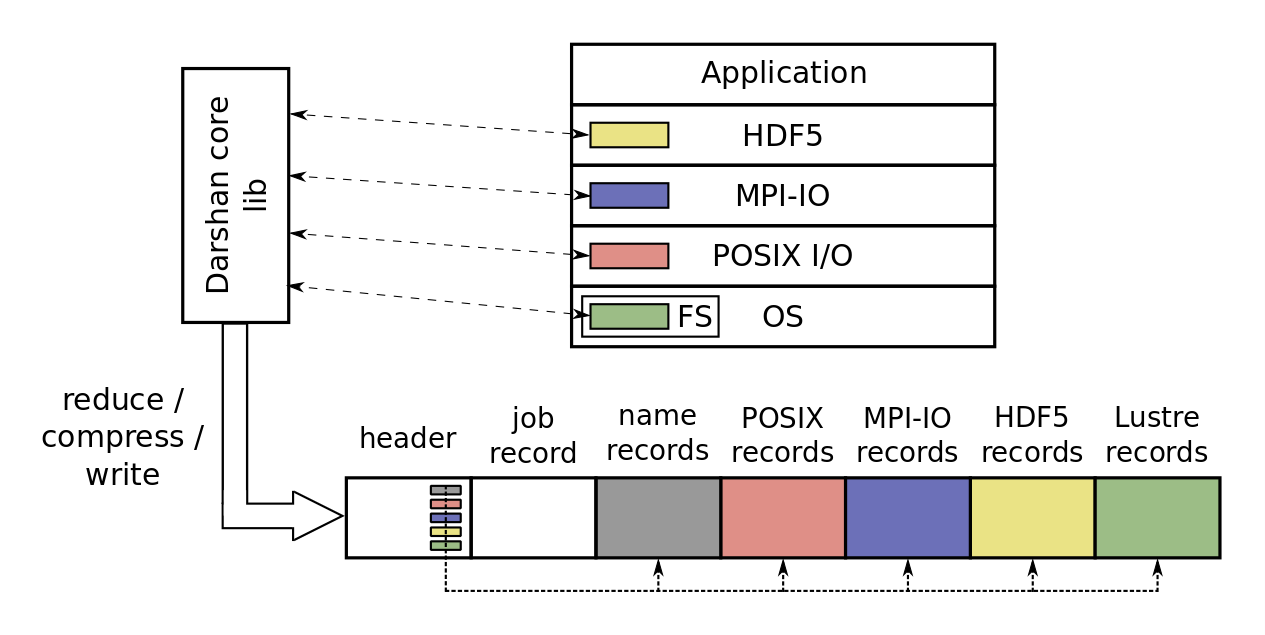
Figure 1 - Darshan’s modular runtime architecture allows collection of I/O statistics from various layers of the I/O stack.
Though Darshan has traditionally focused most of its instrumentation efforts at the POSIX and MPI-IO layers, extended HDF5 instrumentation was integrated into Darshan starting with version 3.2.0. The goal of this work was to not only assist in understanding of HDF5 usage of underlying I/O layers (i.e., MPI-IO and POSIX) within individual applications, but to also more broadly understand the characteristics of HDF5 workloads running in production at HPC facilities where Darshan is deployed.
This new Dashan HDF5 module instruments both the HDF5 file and dataset interfaces (H5F and H5D, respectively), maintaining independent instrumentation records for each HDF5 file and dataset accessed by an application. Some of the statistics captured by this module include:
- File and dataset open/create counts
- Dataset read/write counts and cumulative bytes moved
- Access size histograms and common access information for dataset read/writes
- Common access information includes size, as well as access length/stride for hyperslab selections
- Dataset chunking parameters
- Types of dataspace selections used when accessing a dataset, including regular hyperslab, irregular hyperslab, and point selections
- Dataset dimensionality and total number of points
- Flags indicating whether MPI-IO independent/collective operations are used for accessing a dataset
- Various timers and timestamps characterizing read, write, and metadata operations
This HDF5 instrumentation data allows for a more holistic characterization of application I/O behavior through various I/O abstractions, paving the way for novel insights into I/O performance issues. For example, Figure 2 illustrates various statistics characterizing the I/O of an example execution of the MACSio[2] benchmark (configured to use its HDF5 backend). There are clear differences across the various I/O interfaces in terms of number of different operations issued and access sizes used, helping illustrate how higher-level HDF5 dataset accesses are decomposed into lower-level POSIX file accesses, using MPI-IO. It is clear from the average timing information that comparable amount of application I/O time is spent in the HDF5 and MPI-IO interfaces, compared to a very negligible amount of time spent in the POSIX interface, demonstrating the types of overheads necessary to implement HDF5 and MPI-IO data abstractions.
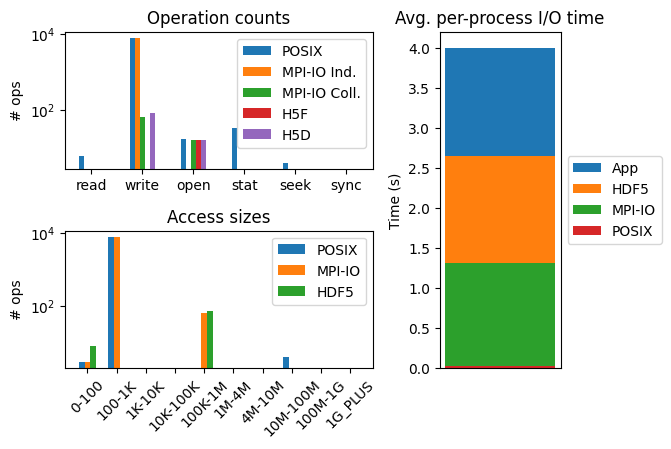
Figure 2 - Total operation counts (left-top), access size histograms (left-bottom) and average per-process timing information for HDF5, MPI-IO, and POSIX I/O interfaces using a simple MACSio benchmark execution. Note the figures on the left use log-scale on the y-axis.
Figure 3 uses radar plots to help illustrate the HDF5 dataset access characteristics of example MACSio benchmark executions using 2D and 3D meshes and different numbers of parts. These plots are helpful for visualizing the length of hyperslab access along various dimensions, which could have a critical impact on I/O performance depending on chunking parameters used to partition datasets. Similar plots could be generated for stride of hyperslab accesses, which is similarly important.
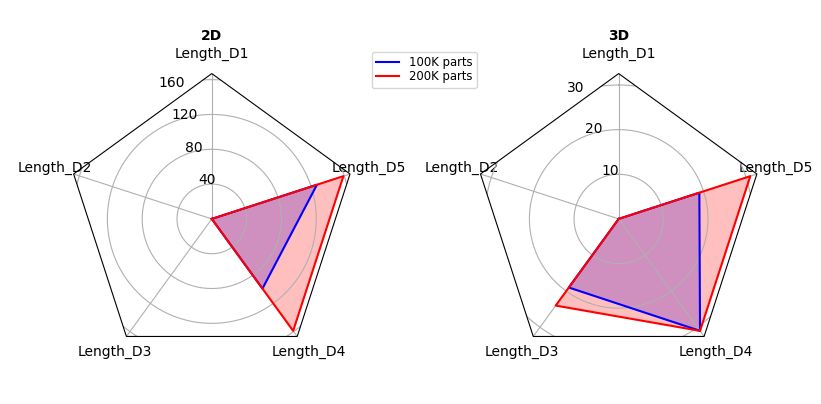
Figure 3 - Radar plots illustrating HDF5 dataset hyperslab access patterns generated by the MACSio benchmark for 2D and 3D meshes. The plots are for the most common access size for the HDF5 dataset generated by the benchmark. Darshan captures this access information for the last 5 dimensions of the hyperslab, with D5 being the last dimension of the dataset (i.e., the fastest changing).
Please refer to darshan-runtime documentation for more information on how to configure/install Darshan and how to enable HDF5 instrumentation. Similarly, refer to darshan-util documentation for more complete description on the various statistics currently captured by the HDF5 module.
Please reach out to the Darshan team if you have any questions, comments, or feedback! You can reach us via our GitLab page or using the darshan-users@lists.mcs.anl.gov mailing list. We are still working on integrating HDF5 data into our analysis tools and we would be very interested if users had ideas on additional data to capture or ways to more easily display this data to enable better understanding of application I/O behavior.
-- Shane Snyder (Argonne National Laboratory)
[1] Though, Darshan can optionally produce fine-grained I/O traces of lower-level POSIX and MPI-IO interfaces