First glimpse of the scaling behavior using CubeGUI/Scaling plugin.
Rarely is the performance of an application at some fixed configuration the only point of interest. Most of the time, the user also would like to know how their application behaves if more resources are added, e.g., using more processes and/or threads. For a more sophisticated modeling of the performance behavior a tool like Extra-P should be used. However, in many cases, just getting an idea of the scaling behavior without a comprehensive study would suffice. In the usual scenario the user would like to know what to expect if he scales up the job size, in the number of CPUs. The CubeGUI Plugin “Scaling” serves this purpose.
Assuming the user has made a series of measurements using for example JUBE with different number of CPUs, they would like to explore the application behavior.

Figure 1: Selection of the "Scaling" plugin.
To use the “Scaling” plugin one starts CubeGUI without any parameter and selects (Figure 1) the “Scaling” plugin in the list of available context-free plugins. Alternatively one could use Menu “File” → ”Context free plugin” → “Scaling”.
One can choose whether to use “profile.cubex” files, “summary.cubex” or other files for the analysis. Additionally there is a choice (Figure 2) to analyze the usage of the resources in the scaling analysis (“Aggregate over system tree”) or to study the run time behavior (“Maximal value in system tree”) before starting the process by selecting “Scaling analysis”.
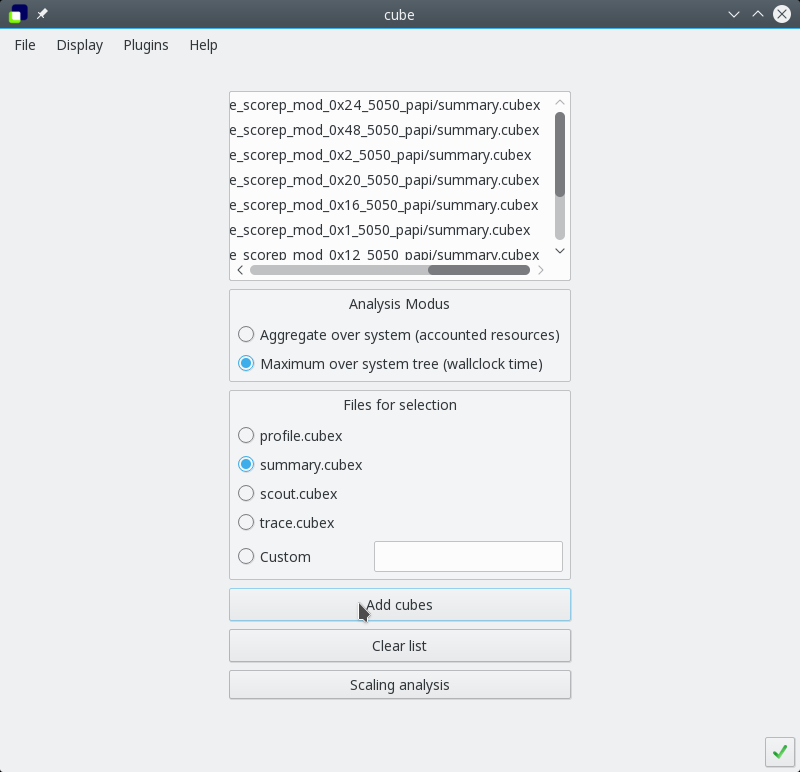
Figure 2: "Scaling" plugin. Selection of the scaling experiment and setting the parameters for the analysis.
As result a cube profile created, where the metric and call tree dimensions are identical, but instead of the system tree a “scaling tree” is shown with the structure: “All Measurements → Measurement N”.
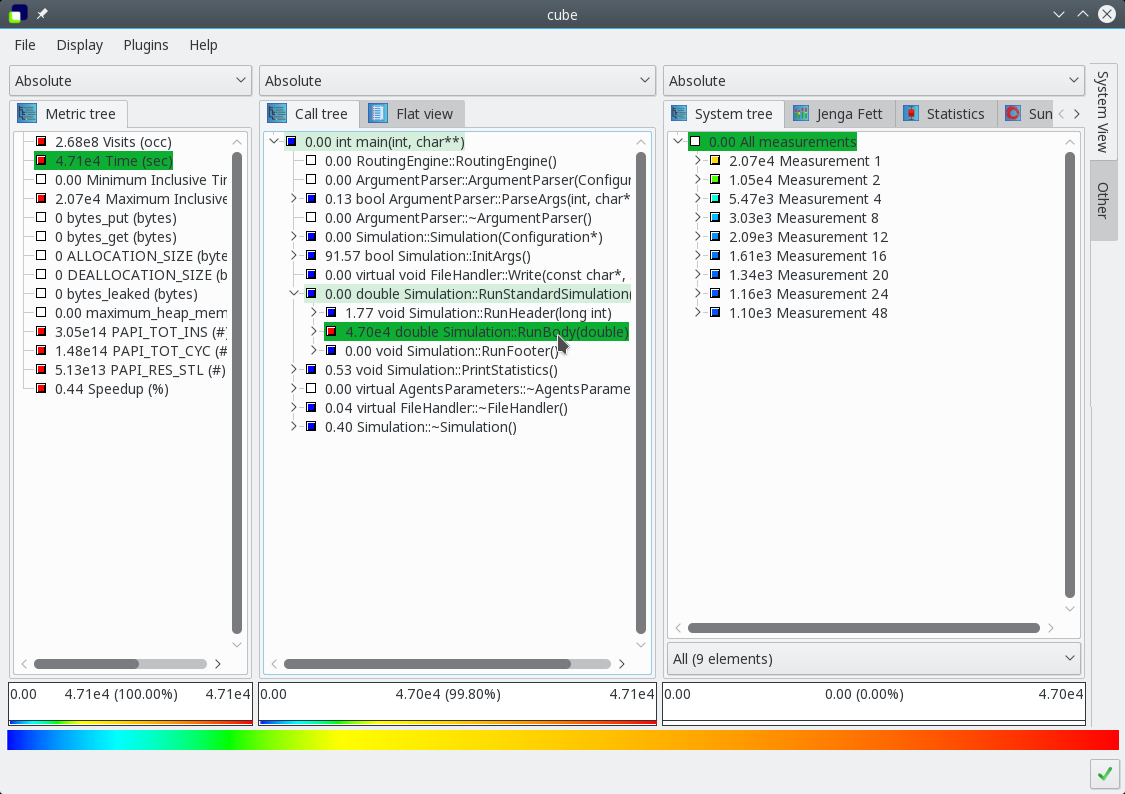
Figure 3: Scaling behavior of the metric "Time" for the call path "RunBody(...)"
By expanding the “Scaling tree” the user can explore (Figure 3) the behavior of different metrics for different call paths. Additionally one can use the JengaFett plugin to visualize (Figure 4) the data more comfortably .
With the selection of “Maximal value in system tree” for the scaling analysis “Scaling” plugin creates the “Speedup” metric automatically and allows to directly calculate it for different scales. Hereby it uses either the metric “Time" (for Profile.cube or scout.cubex files) or metric “Execution" (for Summary.cubex or trace.cubex files).
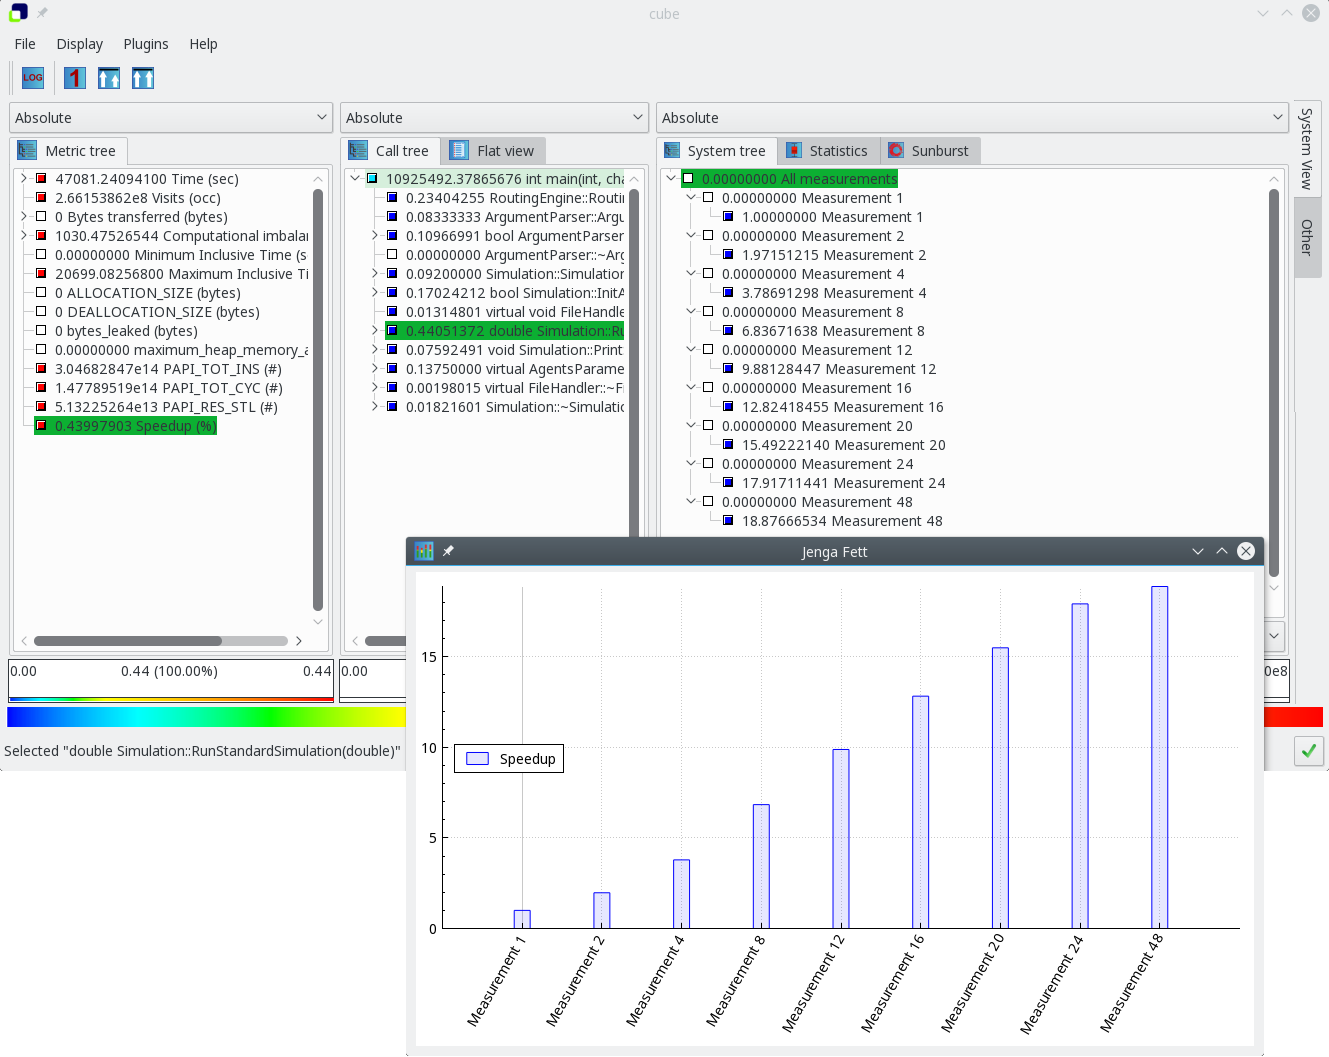
Figure 4: Display metric "Speedup" behavior using plugin "JengaFett"