Modern high-performance computing is increasingly driven by heterogeneous systems that combine traditional CPUs with accelerators, particularly GPUs. Among the accelerator programming models, HIP (Heterogeneous-Computing Interface for Portability) [1] has emerged as a powerful approach to writing portable code across both AMD and NVIDIA platforms. HIP enables developers to port CUDA-style code to target the ROCm ecosystem on AMD hardware while preserving much of the familiar kernel and memory-management semantics.
In this landscape, tool support for performance analysis and tracing of HIP-accelerated applications has become essential. The Extrae tracing toolkit [2], originally developed to capture detailed execution information from MPI, OpenMP, CUDA, and other parallel execution models, evolves to support the HIP runtime as well. This enhancement allows HIP-based codes to be traced seamlessly using the Extrae infrastructure and later analyzed with the full flexibility and expressive power of the Paraver trace analyzer [3]. By using Extrae and Paraver to capture and represent HIP activity, developers gain deep visibility into GPU kernel launches, host-device interactions, and accelerator workloads, supporting performance analysis and optimisation on modern heterogeneous systems.
Tracing HIP with Extrae
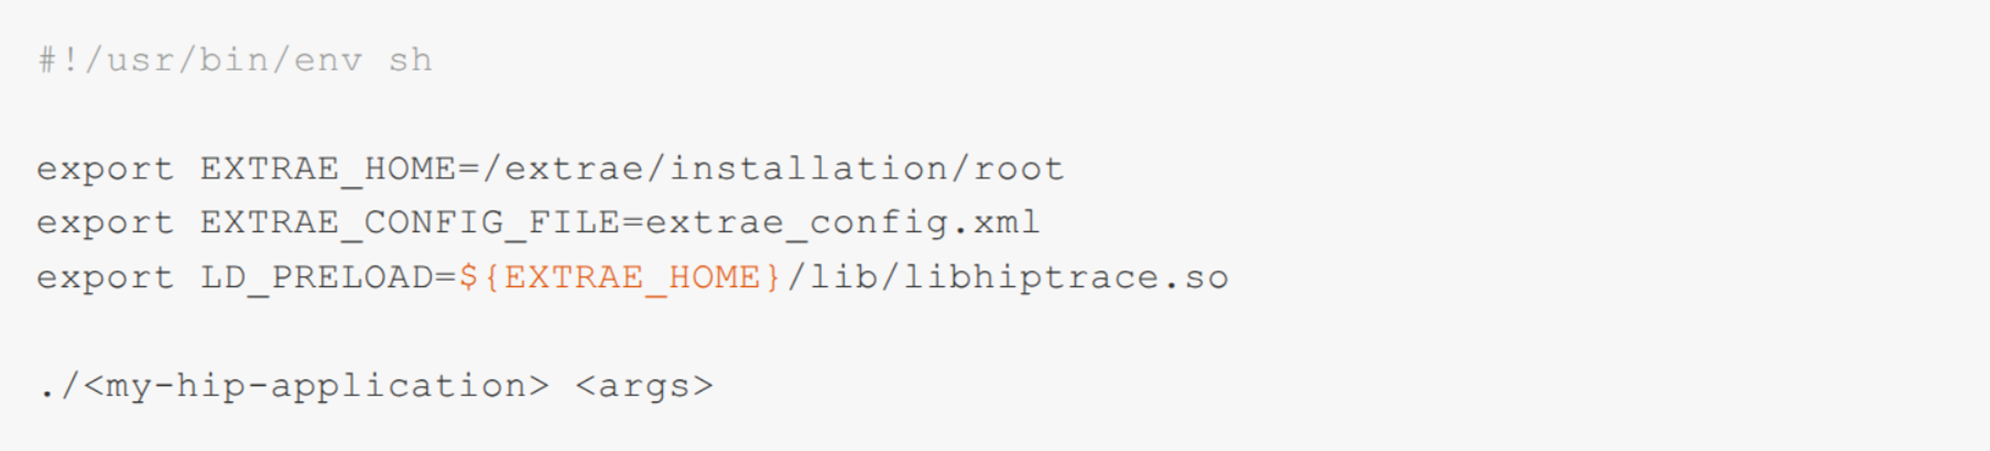
Extrae intercepts GPU activity from HIP applications by dynamically preloading a tracing library at runtime, which means no special compilation flags or custom linking steps are required. Instrumenting a production binary with Extrae only requires a few variables defined in the execution script to load and configure the tool:
Extrae leverages the ROC Tracer APIs, specifically the Callback API (and, soon, the Activity API), to subscribe to HIP-related runtime events. These runtime events are processed and transformed into a Paraver trace that captures the application’s behavior through three types of information: punctual events (e.g., entry and exit of HIP runtime calls), states (e.g., periods during which GPU streams execute kernels or memory transfers), and communications (e.g., interactions between host-side kernel launch requests and the corresponding kernel execution on GPU streams).
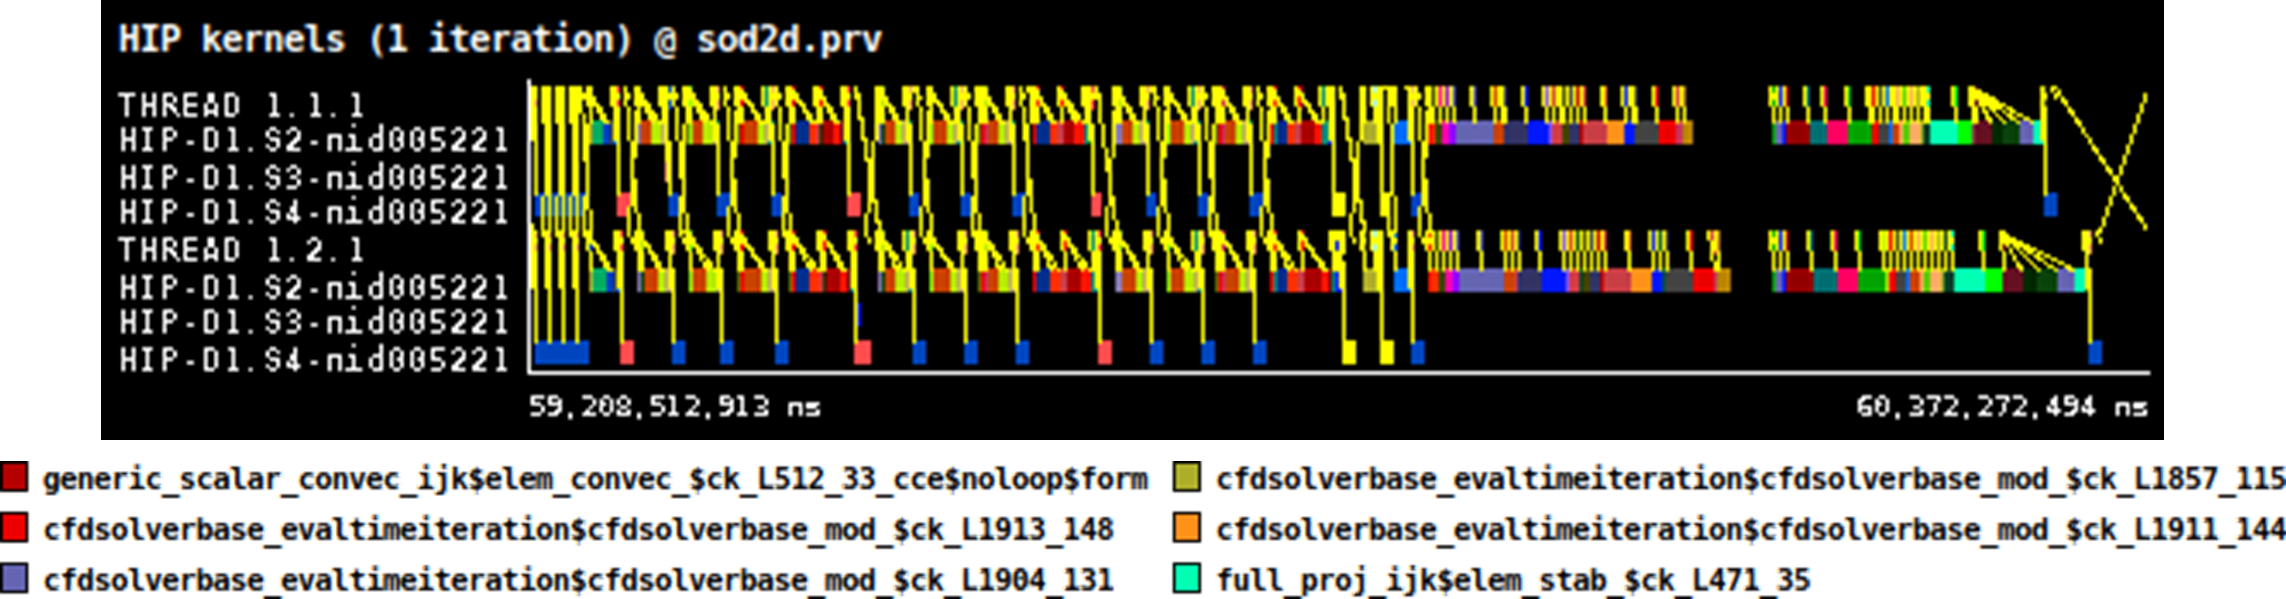
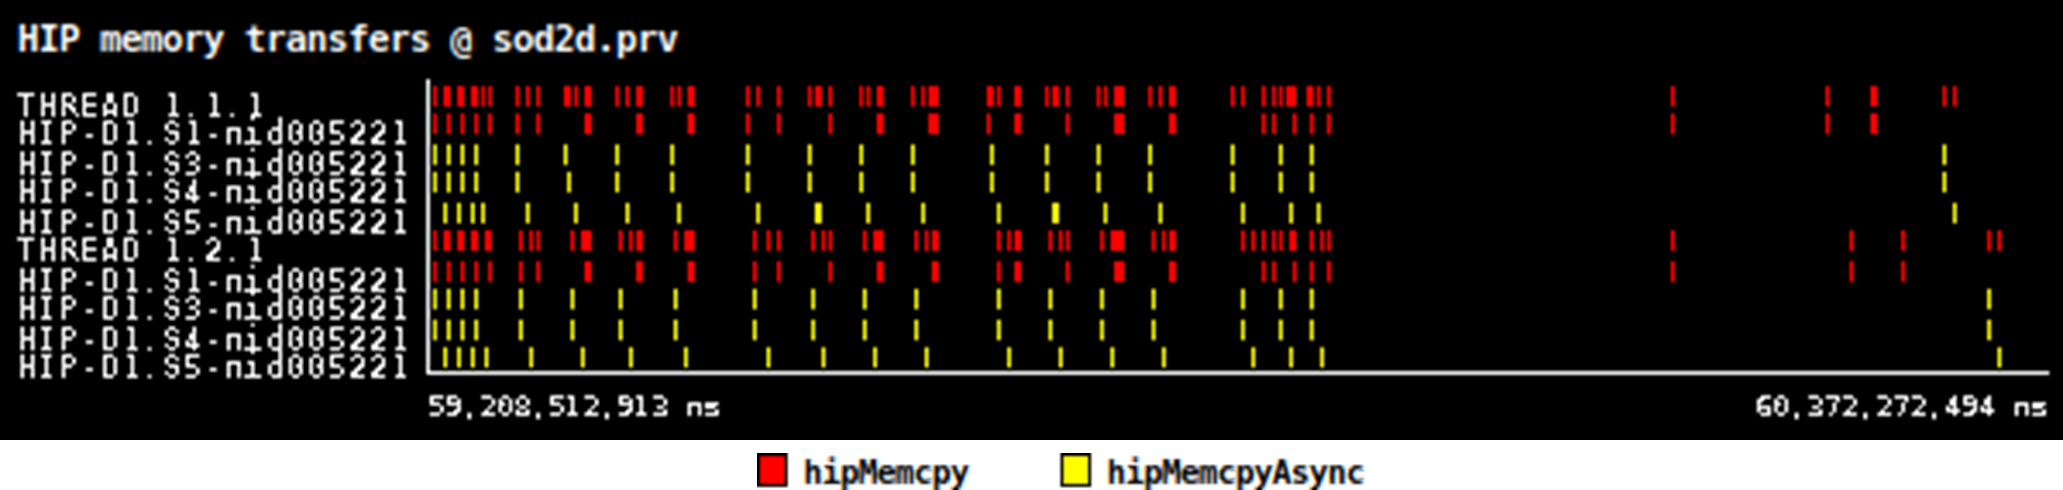
Understanding HIP with Paraver
This information is typically visualized in timelines, where each row represents a resource, such as a CPU process or a GPU stream, allowing users to inspect their activity over time.
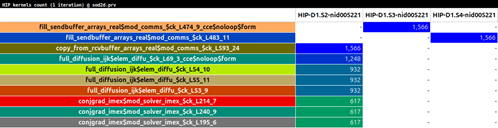
From the generated timelines, Paraver can compute statistics and histograms that deepen the analysis by exposing metric distributions, correlations, and quantitative measurements. One useful example is the kernel time percentage table, which aggregates all GPU kernel executions and reports the fraction of total GPU time spent in each kernel type. Another is the kernel count table, which shows how many times each kernel type is invoked on each stream. These metrics help developers understand which kernels dominate execution time, which ones are invoked frequently, and whether execution patterns or overheads may be affecting performance.
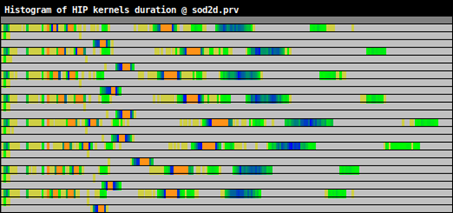
Another useful view is the kernel duration histogram, which shows how long kernels typically run by grouping their execution times into bins. Instead of only seeing average or total time, the histogram reveals the distribution of durations, for instance, whether kernel executions are consistent, whether there are outliers, or whether performance fluctuates due to varying input sizes or workload imbalance. Together, these views help users detect variability, pinpoint bottlenecks, and better understand the overall application behavior.
Support for the HIP runtime up to ROCm 6 has been added to Extrae starting with version 5, and development is ongoing to extend support to ROCm 7. More details about HIP support are available in the Extrae User’s Guide [4] and in the examples distributed with the tool.
-- Germán Llort (BSC)
[1] https://rocm.docs.amd.com/projects/HIP/en/latest/what_is_hip.html
[2] https://tools.bsc.es/extrae