Introduction: Towards a Systematic Approach to Performance Analysis
In High-Performance Computing (HPC), understanding and optimizing the efficiency of parallel applications is a fundamental challenge. The POP Centre of Excellence addresses this by providing a systematic methodology and a suite of tools to help developers. A cornerstone of this approach is a set of well-defined POP metrics, which quantify various aspects of an application's parallel efficiency.
To make the process of calculating and interpreting these metrics more efficient, the POP project has continuously refined its methodology and the accompanying tools. We are now highlighting two key tools offered by the CubeGUI framework that streamline this process: POPAdvisor, which is a reworked version of the previous now-discontinued GUI plugin, and the new command-line tool, cube_pop_metrics, both based on a shared, robust calculation engine that allows for automation, easy maintenance, and future extension of POP metric calculation capabilities.
A Unified Calculation Engine for Consistency and Efficiency
The core strength of the new tools lies in the unification of the POP metric calculation logic. Rather than being in separate codebases, the calculation is now incorporated directly into the cubelib library. This strategic decision ensures that the functionality is available to all tools that use cubelib, including the cube_pop_metrics CLI tool and the plugins for CubeGUI.
This unified approach provides significant benefits:
- Consistency: All tools now derive the same metrics from the same logic, guaranteeing consistent and accurate results regardless of whether you're using the graphical interface or the command line.
- Maintainability: Any future improvements or bug fixes to the POP metrics only need to be implemented once within cubelib, drastically simplifying maintenance and development efforts.
- Extensibility: Adding new POP metrics or refining existing ones becomes a much simpler process, as the core calculation logic can be extended without needing to rewrite code for each tool.
POPAdvisor: Calculating POP Metrics in CubeGUI
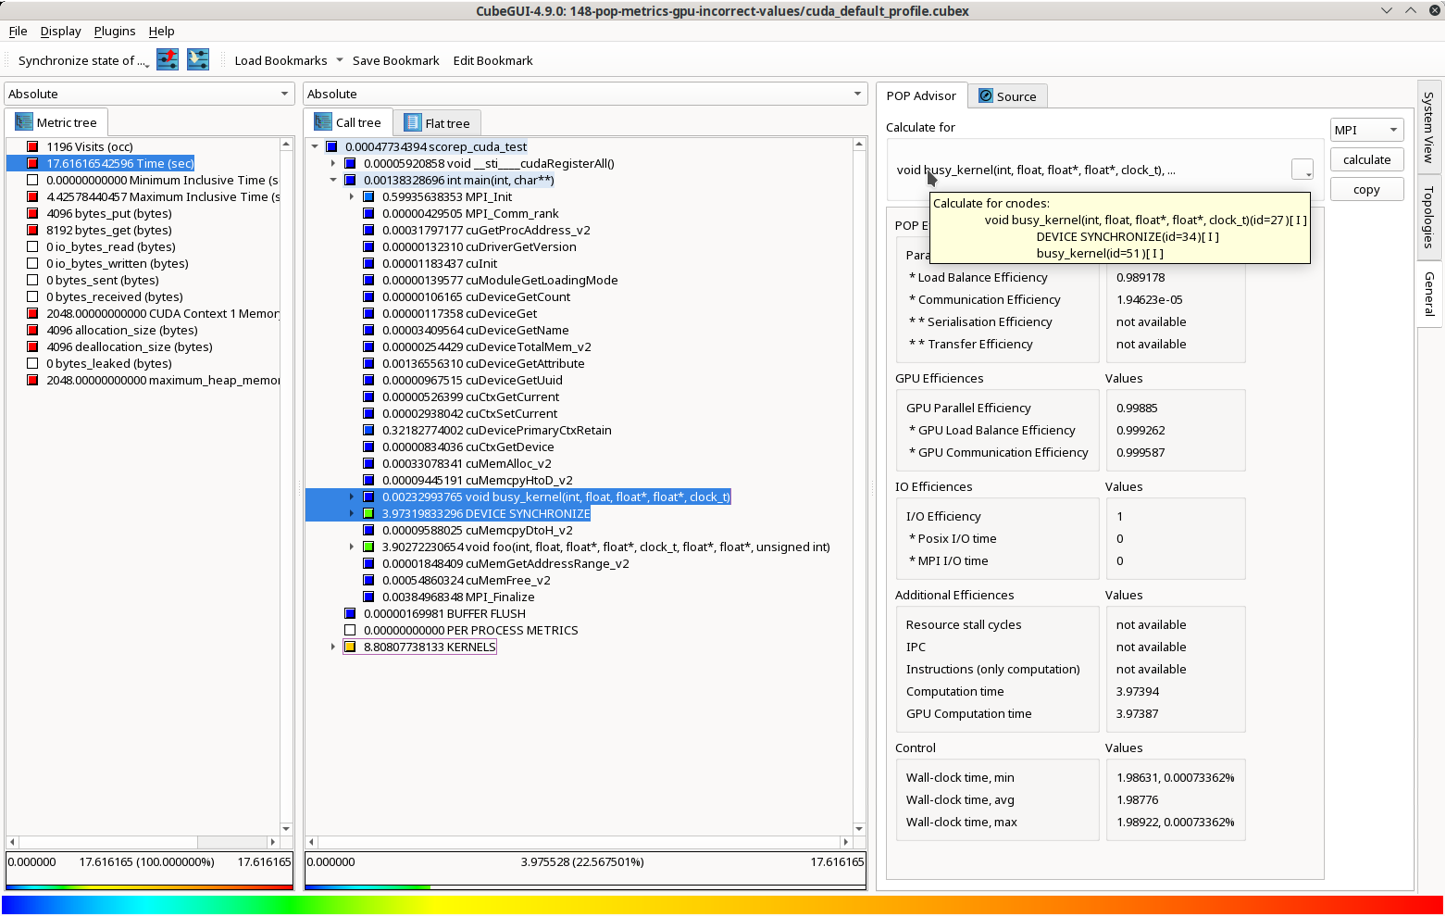
The POP_Advisor plugin transforms CubeGUI into a powerful calculation tool. Once you've loaded a performance report generated by Score-P or Scalasca, activating the POP_Advisor allows you to generate the key POP metrics. Its integration directly within CubeGUI means you can immediately relate these high-level efficiency numbers back to specific sets of functions, call paths, and system resources.
Example Usage in CubeGUI
- Load your Cube file: You can select a .cubex file (if not already loaded).
- Activate POPAdvisor: The POP_Advisor is activated by simply selecting the "General" tab in the right-hand pane of the CubeGUI. For convenience, you can also detach the plugin and place it in its own window, allowing you to explore other aspects of the analysis (like the system tree or other plugins) while keeping the POP metrics visible.
- Select a meaningful focus of analysis (FOA): Choose a set of call paths from the Call Tree pane to be the basis for the calculation.
- Calculate and view metrics: Click the "calculate" button. The plugin will execute the calculation and display the results as a table inside the POP_Advisor widget. This table includes explanatory help and provides a quick overview of your application's performance.
cube_pop_metrics: Scripting POP Performance Efficiency calculation
While the POP_Advisor excels at interactive, visual analysis within CubeGUI, there are many situations where a more automated approach is needed. This is where cube_pop_metrics comes in. This command-line interface (CLI) tool allows you to automate the calculation of POP metrics, making it an essential component for scripting and batch processing workflows.
The tool's purpose is straightforward: it takes a Cube file (.cubex) and FOA as input and outputs the calculated POP metrics. Because it shares the same core calculation logic as the POP_Advisor plugin, you can be confident in the consistency and accuracy of the results.
This approach is highly effective for:
- Continuous Integration (CI): Integrate the tool into your build process to automatically check for performance regressions with every code change.
- Batch Processing: Run analyses on a large number of .cubex files without any manual interaction.
- Remote Workflows: Execute the tool directly on a login node of an HPC system, avoiding the need to transfer large performance files to a local machine.
Example Usage
To quickly calculate the POP metrics for a file named profile.cubex, you simply run:
cube_pop_metrics -c 27,34  profile.cubex

Reading profile.cubex ...  done.
Calculating .................

-------------- Result --------------
profile.cubex -> Profile 0

Only-MPI Assessment
------------------------------------
Calculate for "void busy_kernel(int, float, float*, float*, clock_t)[id=27],DEVICE SYNCHRONIZE[id=34],busy_kernel[id=51]"
------------------------------------

POP Metric                                            Profile 0
------------------------------------
Parallel Efficiency                                   0.000019
* Load Balance Efficiency                             0.989178
* Communication Efficiency                            0.000019
* * Serialisation Efficiency                          nan
* * Transfer Efficiency                               nan
------------------------------------

GPU Metric
------------------------------------
GPU Parallel Efficiency                               0.998850
* GPU Load Balance Efficiency                         0.999262
* GPU Communication Efficienc                         0.999587
------------------------------------

IO Metric
------------------------------------
I/O Efficiency                                        1.000000
* Posix I/O time                                      0.000000
* MPI I/O time                                        0.000000
------------------------------------

Additional Metrics
------------------------------------
Resource stall cycles                                 nan
IPC                                                   nan
Instructions (only computation                        nan
Computation time                                      3.973944
GPU Computation time                                  3.973868
------------------------------------

FOA Quality control Metrics
------------------------------------
Wall-clock time; min                                  1.986306, 0.073362%
                avg                                   1.987764
                max                                   1.989222, 0.073362%
The callpath identifiers 27 and 34 in this example are the callpaths that were explicitly specified by the user to define the Focus of Analysis (FOA). Kernel callpath with identifier 51 was then automatically included because the corresponding kernel is launched during the execution of the defined FOA, ensuring the full parallel work is accounted for in the metrics.
This command provides a fast and reliable way to get a summary of execution performance. It's a key tool for anyone looking to automate their performance analysis and integrate it into a larger HPC workflow.
Tips and Tricks: Simplifying POP metric calculation
There are several ways to simplify the calculation process, allowing for faster iterations and a quicker path to actionable results:
- The Focus of Analysis is rarely a single function but rather a specific, non-trivial group of closely-related callpaths. Limiting calculation to this specialized selection reduces the scope of the analysis and improve processing speed. For applications with asynchronous kernels, a meaningful FOA is often a callpath that includes a synchronization barrier to ensure the completion of all launched kernels.
- Multi-select callpaths: To define a multi-path FOA, expand the Call Tree and select individual call paths while holding the Ctrl key. POP_Advisor uses this selection for metric calculation.
- Verify selection (Tooltip): The plugin helps you verify your selection. A tooltip displayed over the FOA specification within the POP_Advisor plugin indicates which call paths are included. Each selected path is marked with an 'I' (if taken in its inclusive sense) or an 'E' (if taken in its exclusive sense).
- Bookmarks to remember the FOA: Finding the optimal FOA can involve trial and error, and you may need to compare metrics across different selections within a single measurement. Bookmarks allow you to save and restore complex FOA selections instantly.

- Enable and Save: Enable the "Bookmarks" toolbar and use the "Save Bookmark" function to store the current selection and expansion state of the Call Tree.

- Cubefile-specific storage: Bookmarks are specific to the file currently loaded, e.g., they are stored in a profile.ini file associated with a profile.cubex file. When you open a different profile, you will access the bookmarks saved for that new file.
- Re-using FOA for another profile: A typical Score-P measurement experiment directory, after processing by tools like Scalasca, contains several analysis files, such as profile.cubex, summary.cubex, scout.cubex, and trace.cubex. These files are generated from the same run and therefore share an identical call tree structure and internal identifiers. This congruence allows for a simple trick to reuse a complex FOA.
- Work out the FOA: Define your complex FOA selection while working in summary.cubex and save it as a bookmark. CubeGUI saves this selection in the corresponding initialization file summary.ini in the same directory.
- Apply the trick: Because the call tree identifiers are identical, you can link or copy this summary.ini to trace.ini file (or the .ini file for any other related .cubex file in that directory).
- Load bookmark: When you open the trace.cubex file in CubeGUI, you can now load the saved bookmark, and the selection will correctly restore and select the specified callpaths, allowing you to then quickly calculate the additional POP metrics.
- This approach currently serves as a semi-reliable workaround. We plan to integrate a dedicated, more streamlined feature for managing and reusing FOAs across profiles in upcoming versions of CubeGUI. Furthermore, this future improvement will also allow the selected and saved FOA to be seamlessly used for specification within the cube_pop_metrics CLI tool.
Additional Metrics for a Quick Overview
Next to the standard POP metrics, both the POPAdvisor and cube_pop_metrics tools provide more information for a fast overview of an application's performance. These additional metrics allow you to immediately pinpoint potential performance issues.
- GPU-related metrics: These metrics assess the efficiency of GPU usage. For example, they calculate “GPU load imbalance” and "GPU communication efficiency." Here, "communication" refers to the orchestration overhead associated with launching computations on the GPU as well as network communication between processes.
- File I/O Metrics: When I/O is measured, the tools provide information on I/O efficiency and the time spent on different types of file I/O, such as POSIX I/O and MPI I/O.
- Additional Metrics: This section delivers a set of metrics that provide a deeper look into resource usage. These include data on cycles stalled for resources, CPU cycles, number of instructions, and the time spent in user code on both the CPU and GPU. These metrics are available only if included in the measurement.
- FOA Quality Control Metrics: These offer statistics on wall-clock time across the machine. This helps you judge how consistent the execution was across different compute nodes where MPI processes were running, providing a sanity check on the measurement itself.
These metrics enable a quick assessment of an application's overall performance, allowing you to quickly identify areas that require further investigation.
Conclusion: A Unified Approach to HPC Performance
The synergistic relationship between the cube_pop_metrics CLI tool and the POP_Advisor plugin for CubeGUI represents a robust approach to performance analysis. By centralizing the complex POP metric calculation logic within a single library, the POP has delivered a solution that is consistent, maintainable, and highly flexible.
This unified approach streamlines the entire workflow. Whether you prefer the interactive analysis of the graphical user interface or the automated power of the command line, you are now equipped with an even more effective means to evaluate your parallel applications.
This version of POP_Advisor and cube_pop_metrics is available from release 4.9 of CubeLib/CubeGUI and can be downloaded from scalasca.org. For ease of installation, we also provide recipes for EasyBuild and Homebrew, as well as pre-built binaries for Linux, Windows, and macOS.
-- Pavel Saviakou (JSC)